Partner Spotlight: MetricsFlow
Introduction
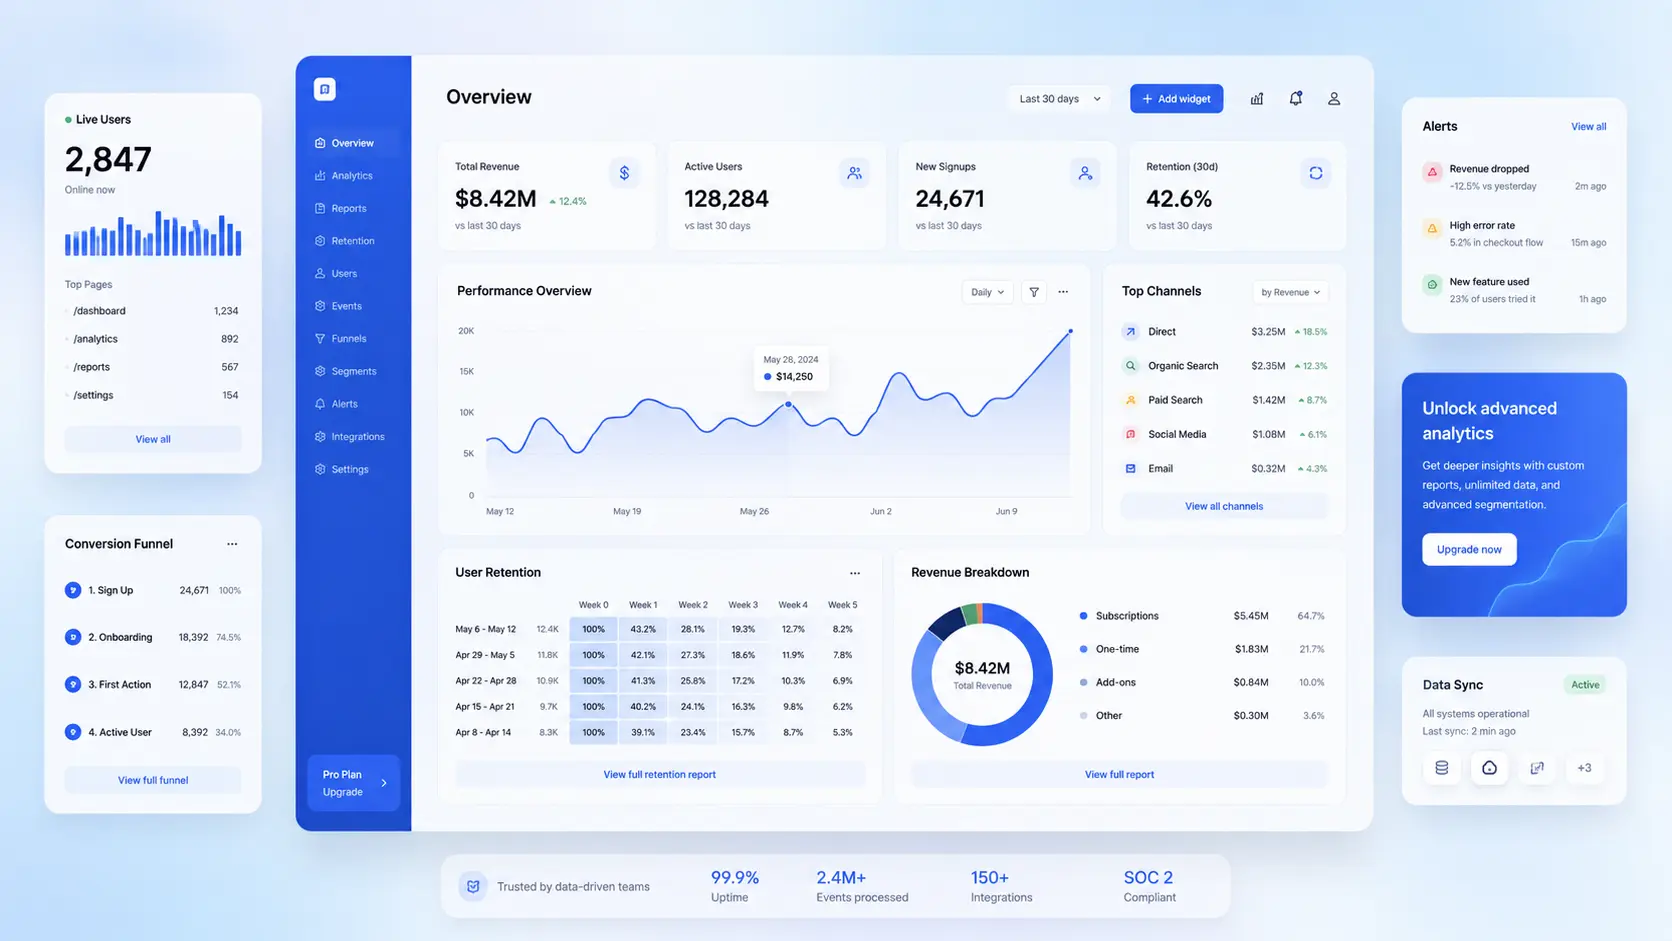
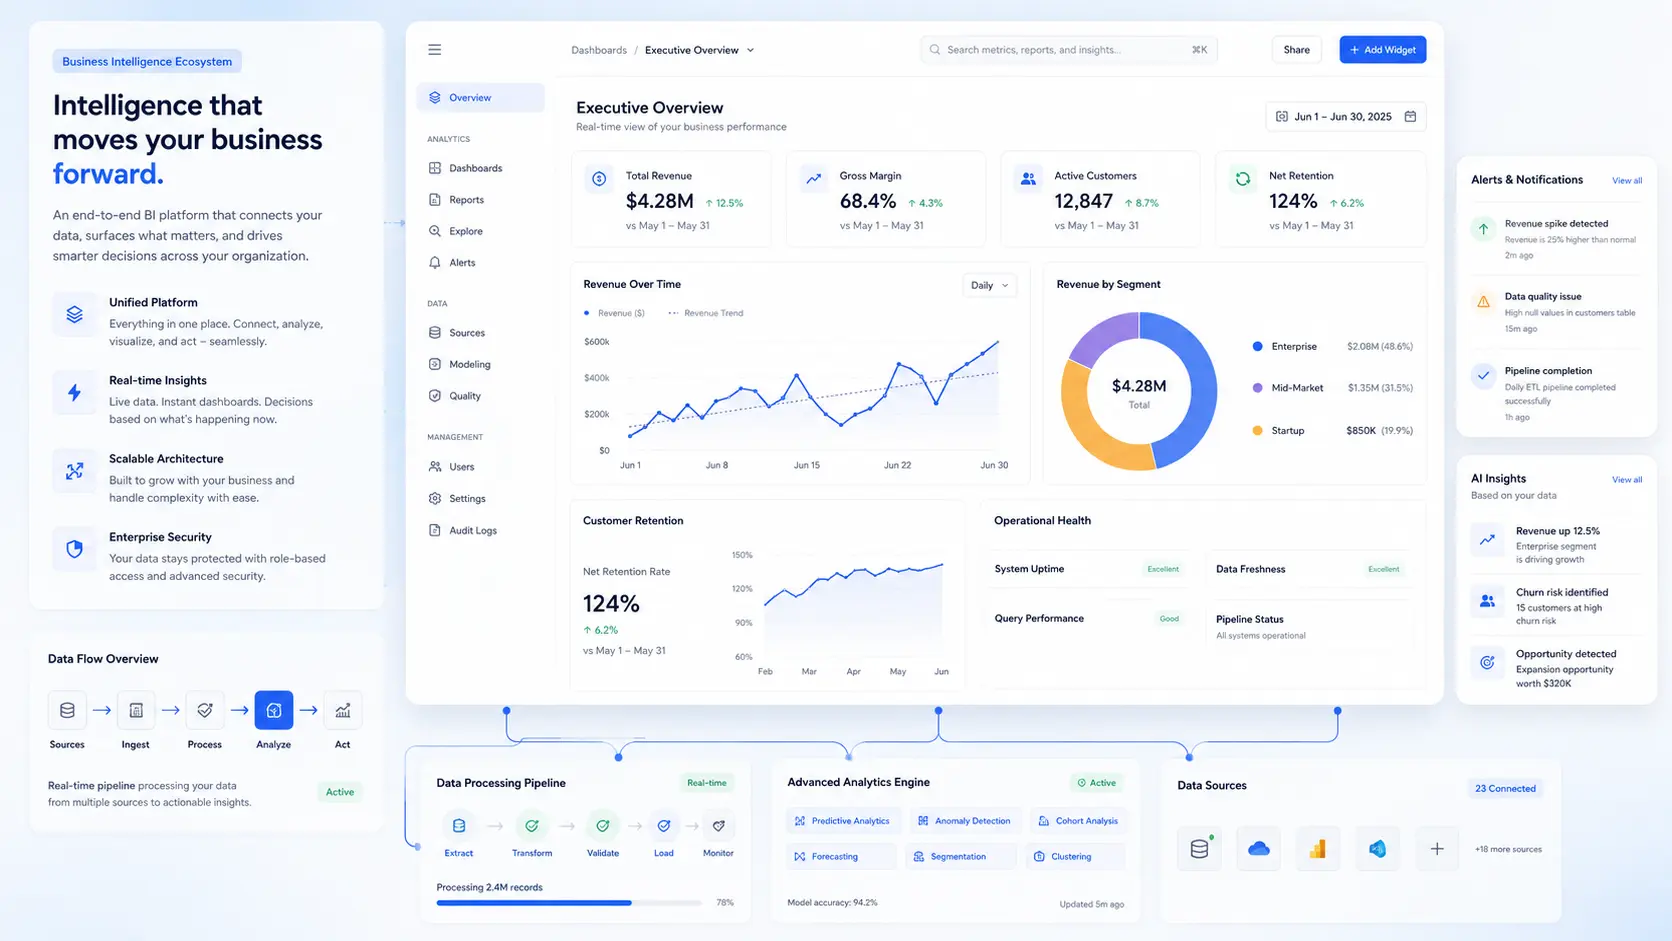
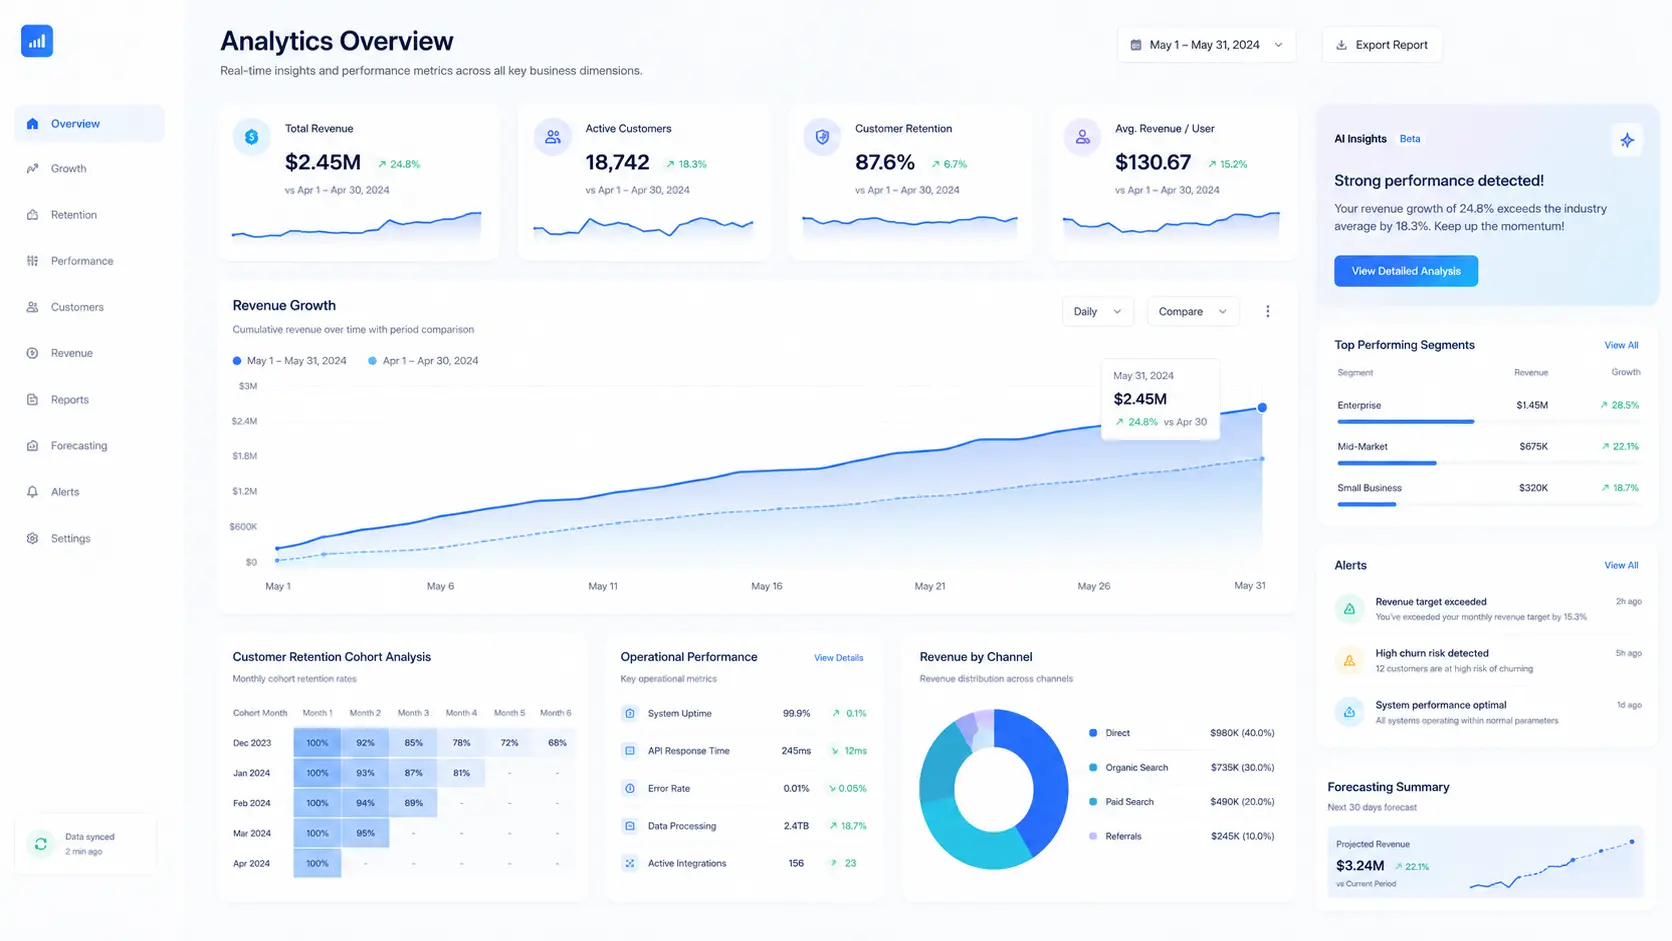
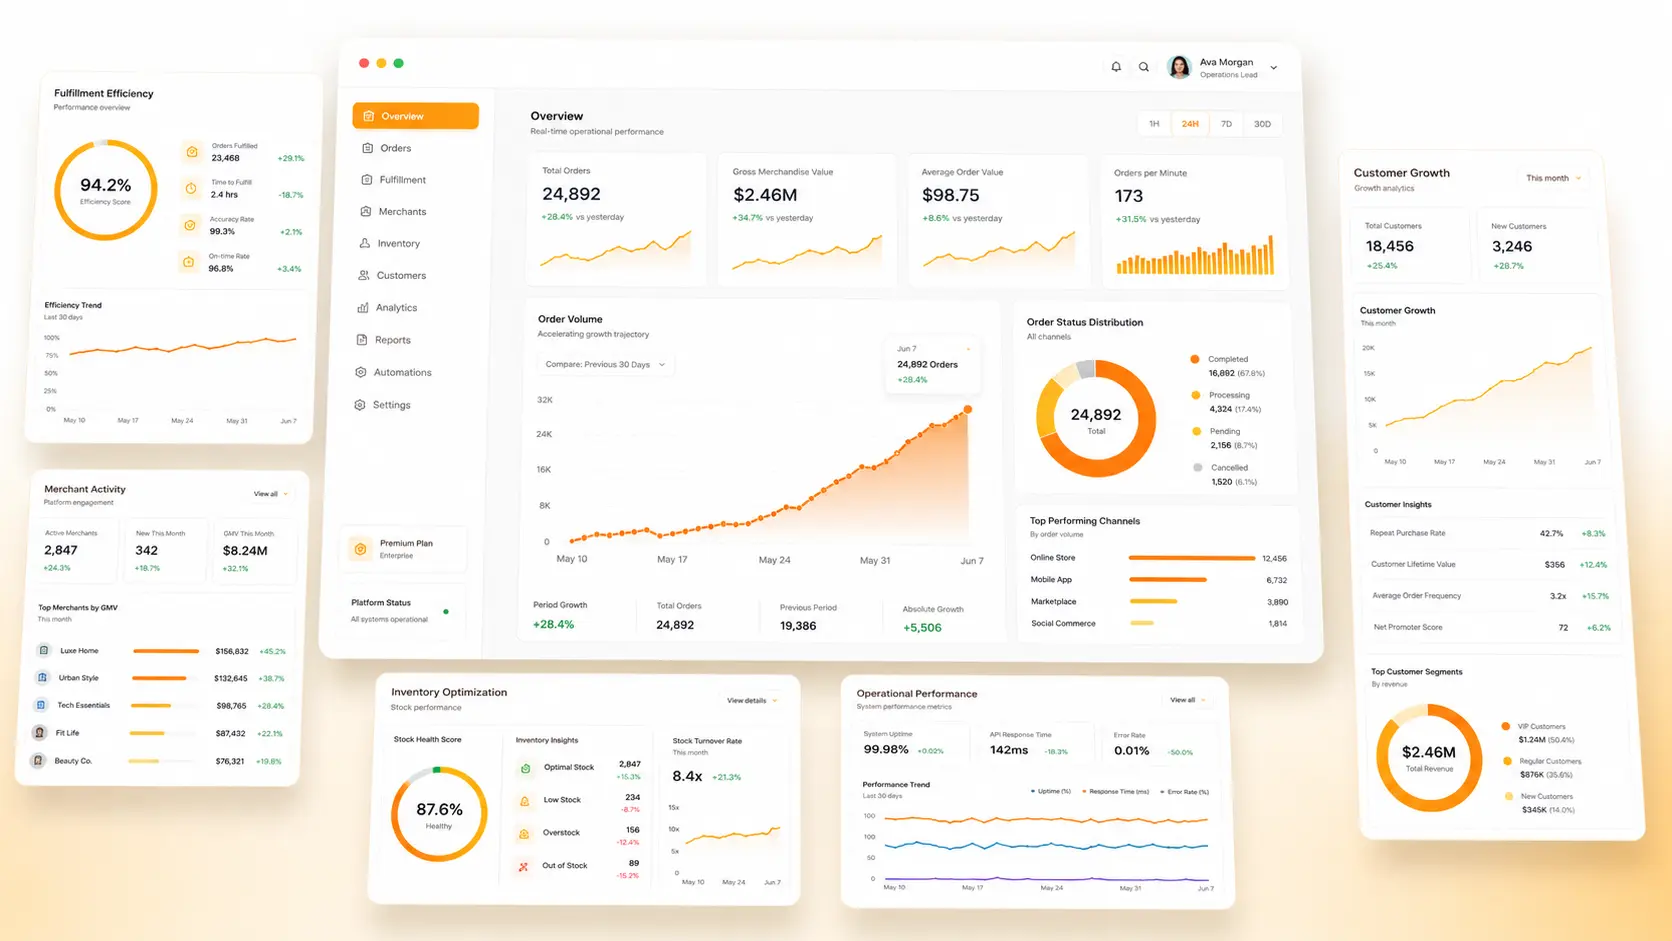
MetricsFlow is a high-growth B2B analytics platform supplying real-time usage statistics to major software platforms. Despite having strong underlying tracking, their dashboard was experiencing severe latency. On average, page layouts and visual graphics required over 12 seconds to compile and load, causing initial users to drop off in frustration.
“The collaboration with Kliivo exceeded all expectations. They understood our brand, built high-capacity telemetry streams, and launched a beautiful dashboard that converted users instantly.”— Founders Council Review, MetricsFlow
Before & After
- Dashboard load took 12+ seconds
- No query indexing or caching layer
- High CPU bottlenecks under spikes
- Client retention dropping continuously
- Sub-second load in 0.8 seconds
- Redis caching & query indexing live
- 58% reduction in server costs
- 42% bump in platform user retention
The Challenge
The bottleneck resided in non-optimized database queries and direct dynamic table calls on every dashboard refresh. The system had no caching tier, meaning standard queries were processed repeatedly from scratch, blocking server CPU threads and choking rendering processes during high-volume spikes.
“Resolving latency bottlenecks and structural processing delays was critical. Kliivo analyzed our codebase, isolated CPU leaks, and built a lightning-fast data stream.”— Technical Review, MetricsFlow
Our Approach
Kliivo re-architected MetricsFlow's backend entirely. We introduced a robust Node.js server engine paired with high-performance Redis caching layers. Active query models were indexed, and static charts were pre-computed at the edge. On the front-end, we refactored code using Next.js App Router and optimized data-fetching patterns.
 Next.js
 TypeScript
 Node.js
 Redis
Redis PostgreSQL
 Tailwind CSS
Key Takeaways & What Changed
Dashboard responsiveness went from sluggish to immediate. The application could scale seamlessly under sudden query traffic jumps, with serverless processing costs decreasing significantly.
SaaS dashboard retention is directly tied to performance speed. Introducing low-latency Redis caching layers and edge pre-computation ensures B2B platforms remain fast, responsive, and delightful to use.
Interactive Core Metrics
Real performance telemetry compiled through full launch metrics
Dashboard latency was slashed from 12s to 0.8s.
Pre-computation reduced active CPU cycles by 62%.
User retention spiked on page loads immediately.
Project Performance
More Case Studies
 Web
WebApex Capital — Premium Real Estate Web Portal
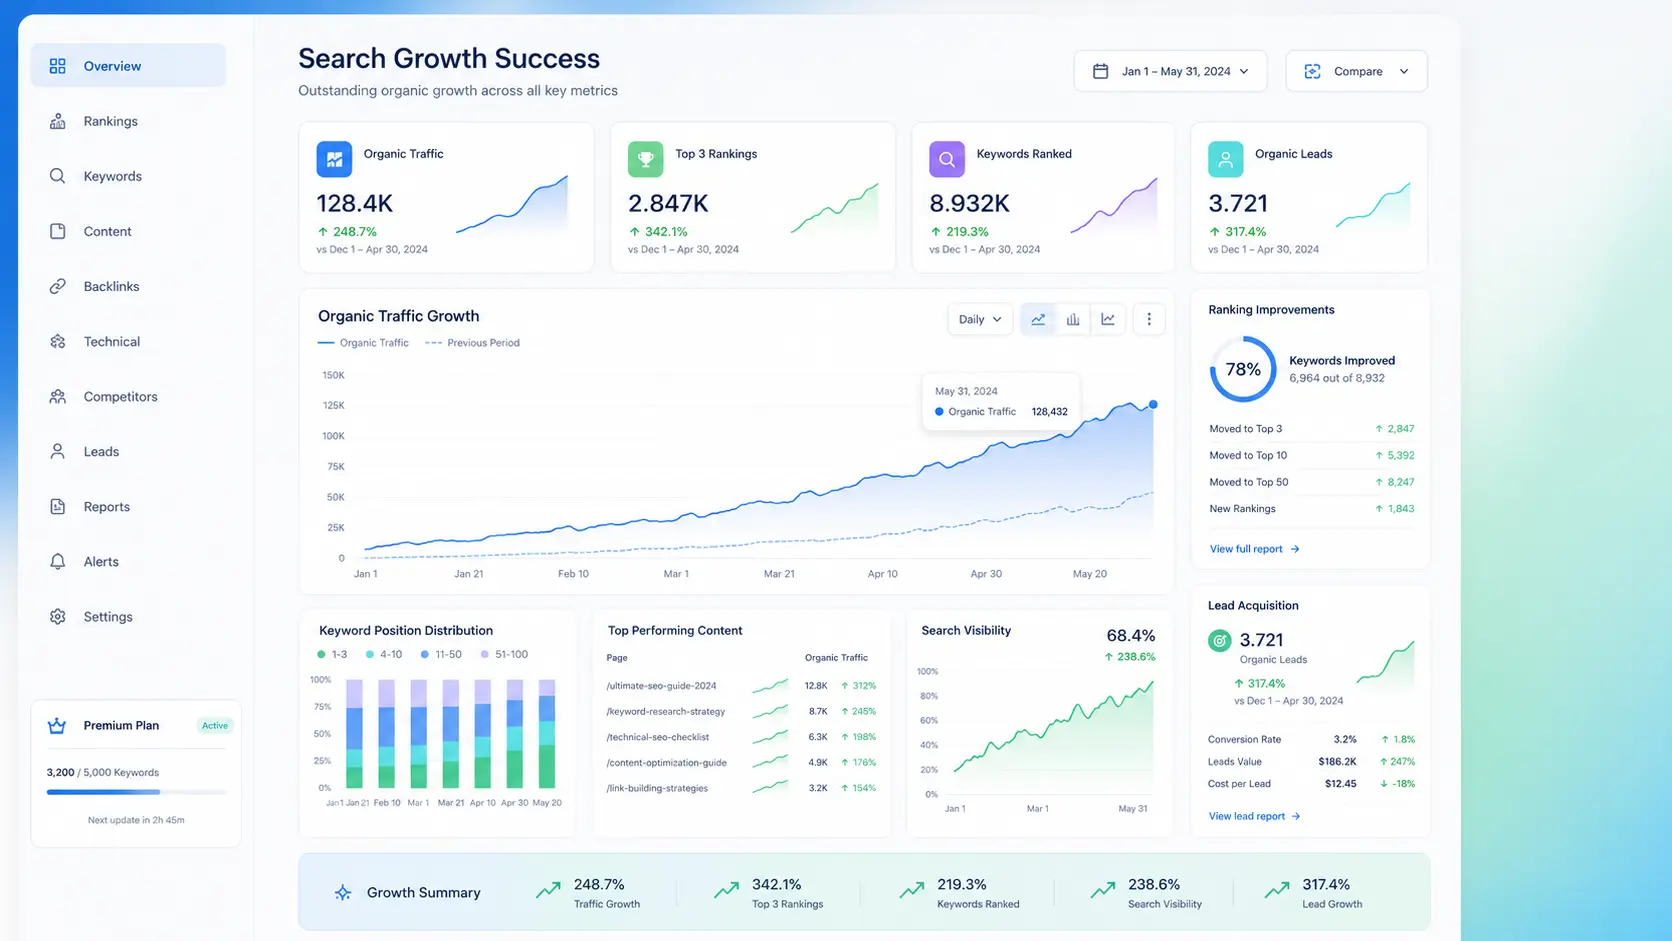 SEO
SEOEduSpark — Programmatic SEO Traffic Optimization Campaign
 Web
WebQuickCart — Hyperlocal Grocery Infrastructure Transformation
Ready to Build Something Great?
Let's turn your ideas into functional, premium digital experiences that scale.
Start Your Project Now